
Billions of dollars have been invested in the development of reverse smokestacks that suck up carbon dioxide that we’ve pumped into the atmosphere and store it underground where it can’t accelerate global warming.
Unfortunately, the technology has not been as effective or as scalable as hoped — with one exception. It’s called a tree.
Through photosynthesis, trees convert light into food. Through the same process, trees suck up carbon from the atmosphere, storing it in their trunks and sequestering it underground via their roots.
That works until the trees are cut down, die or burn, and the stored carbon returns to the atmosphere. At the same time, people need wood to build houses and schools and print newspapers. Land needs to be cleared for farming, for roads, for solar panels. How do you figure out what to cut and what to save?
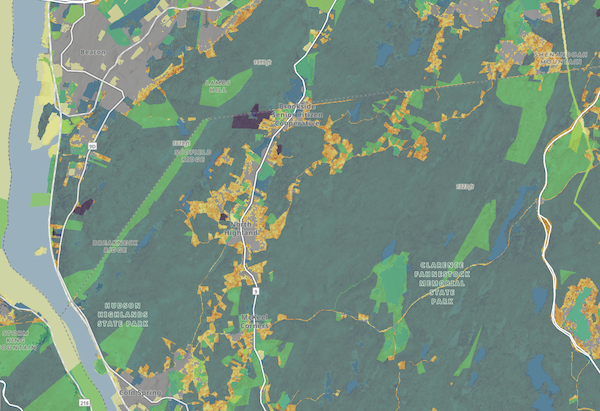
Working with partners, the Open Space Institute created public mapping tools that show how much carbon each parcel of land across the U.S. is storing. One map, at bit.ly/OSIcarbon, covers the country, while another at bit.ly/NYCarbon focuses on New York state.
Abigail Weinberg of OSI said that when researchers discuss using trees as tools for climate change mitigation, it’s typically in the context of planting more to sequester carbon and provide shade. Less discussed is the protection of our dense forests. American forests store 300 times more carbon than they suck up each year. “When you lose that storage, it’s huge,” she said.
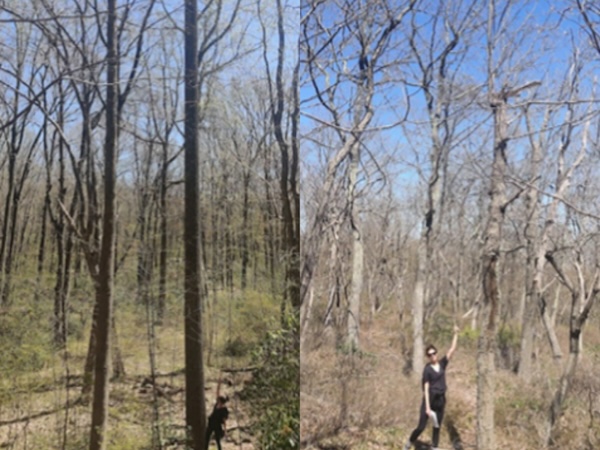
How do you identify a high-carbon forest? “You know them when you see them,” said Weinberg, showing me two photos taken in Fahnestock State Park. The photo on the left (1) has tall, dense trees and a lush understory that was already thickening in the early spring. The forest shown on the right (2), which stores less carbon, has shorter trees, rockier soil and more open space.
OSI did not, of course, walk every acre in the country to create its maps but used a combination of fieldwork, satellite imagery and forest inventory reports. They were developed so that OSI could determine which parcels should be prioritized in conservation efforts and made public, allowing municipalities to use them to identify the best locations for housing or renewable energy projects.
Tools like the OSI maps and Bard College’s new air quality monitoring maps are becoming increasingly important as the Trump administration removes climate data from government websites or considers doing so. For example, a notice on a page on the U.S. Forest Service website that explains carbon sequestration by forests and its role in climate adaptation states that it is “under review.” (The page that details the numerous things that can be made from harvested trees has no such banner.)
Looking over the OSI maps, I was surprised by how much more carbon the Catskills store than the Adirondacks, but Weinberg pointed out that the Catskills have been logged and managed far less intensely than the Adirondacks. Both Hiddenbrooke and the former Texaco plant in Beacon stand out as storing significantly more carbon than the surrounding landscape, which Weinberg said is likely due to a combination of good soil, flat land and trees that have been left undisturbed for decades.
A housing or development site called Glenham Mills is being proposed for the former Texaco plant site. Should it not be because of the high-carbon forests? Not necessarily, said Weinberg. As an OSI colleague, Neil Jordan, layered filters over the map, Weinberg pointed out other factors to consider. Is there water flowing through the site? Is it a vital corridor for animal migration? “We always recommend bringing in other data sets so that you don’t just end up protecting an old fuel station that’s isolated,” she said.
As a counterexample, she showed me an area that the combination of maps had revealed to be a conservation priority: a sliver of land north of Saratoga Springs, south of Fortsville, between Route 9 and the Thruway. As Saratoga continues to grow, the surrounding land is at risk of development. Yet the silver contains the last remaining migration corridors between the Adirondacks and the Green Mountains of Vermont. “Seeing those overlays is important as opposed to just thinking about carbon,” Weinberg said.
I asked what other benefits of forests aren’t apparent from the maps.
“Beauty,” Weinberg said. “Joy. Wonder.”
No matter how good your data is, some things can’t be quantified.
